Mapping America's Futures
How will our population change in the next 20 years? That was the simple question that we started with. This is the type of project that our team at Urban lives for. It started with an idea, and, from the beginning, we were able to help shape and mold the project into a successful suite of products.
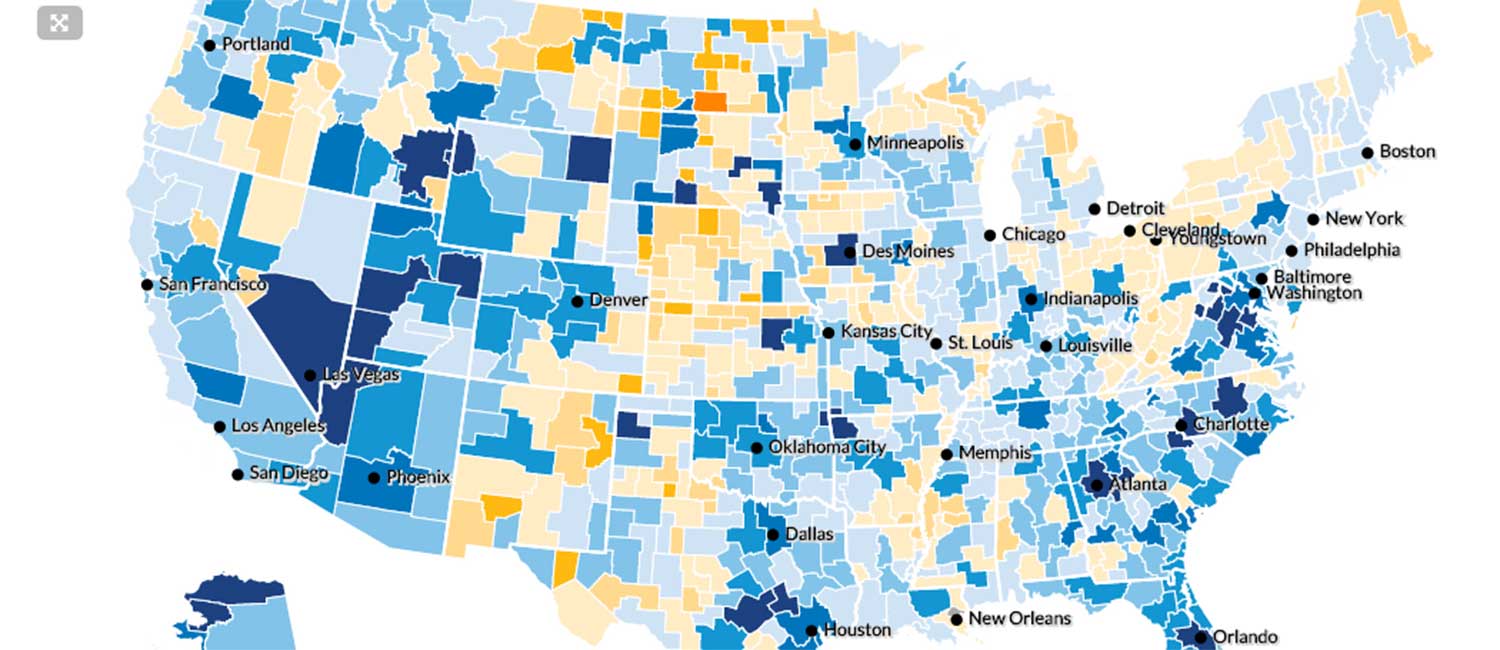
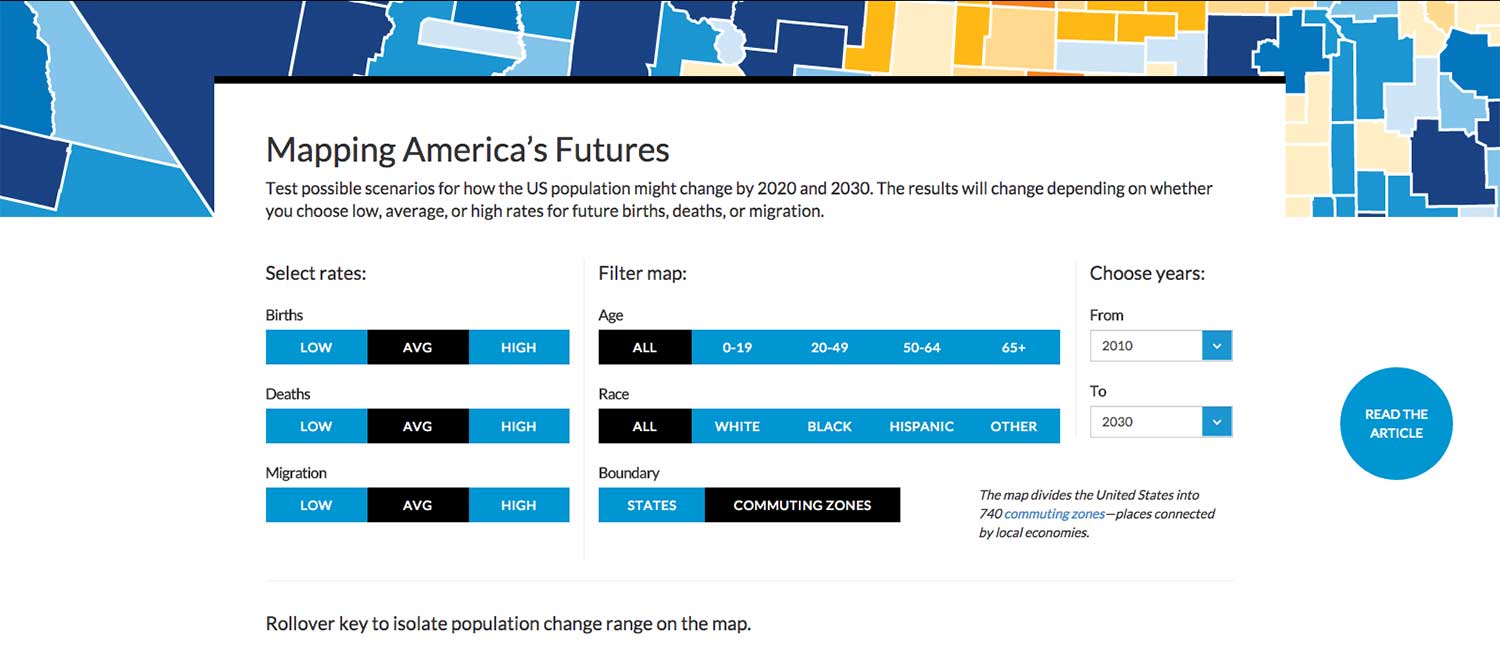
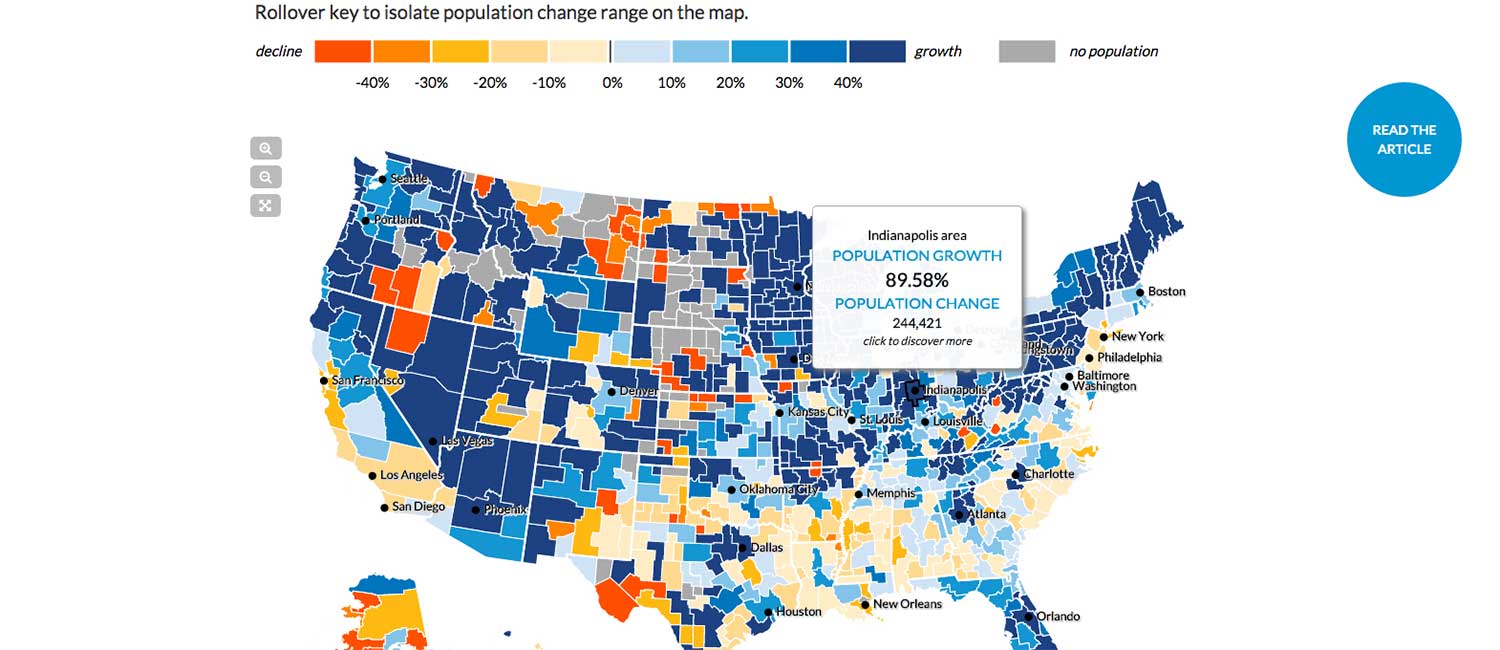
The interactive map portion evolved over more than a year. We built a lot of functionality into the pacakge, allowing users to manipulate the model to home in on their specific scenario. Users were able to adjust for high, average, and low births, deaths, and migration; and they were able to filter the model for specific age and race combinations.
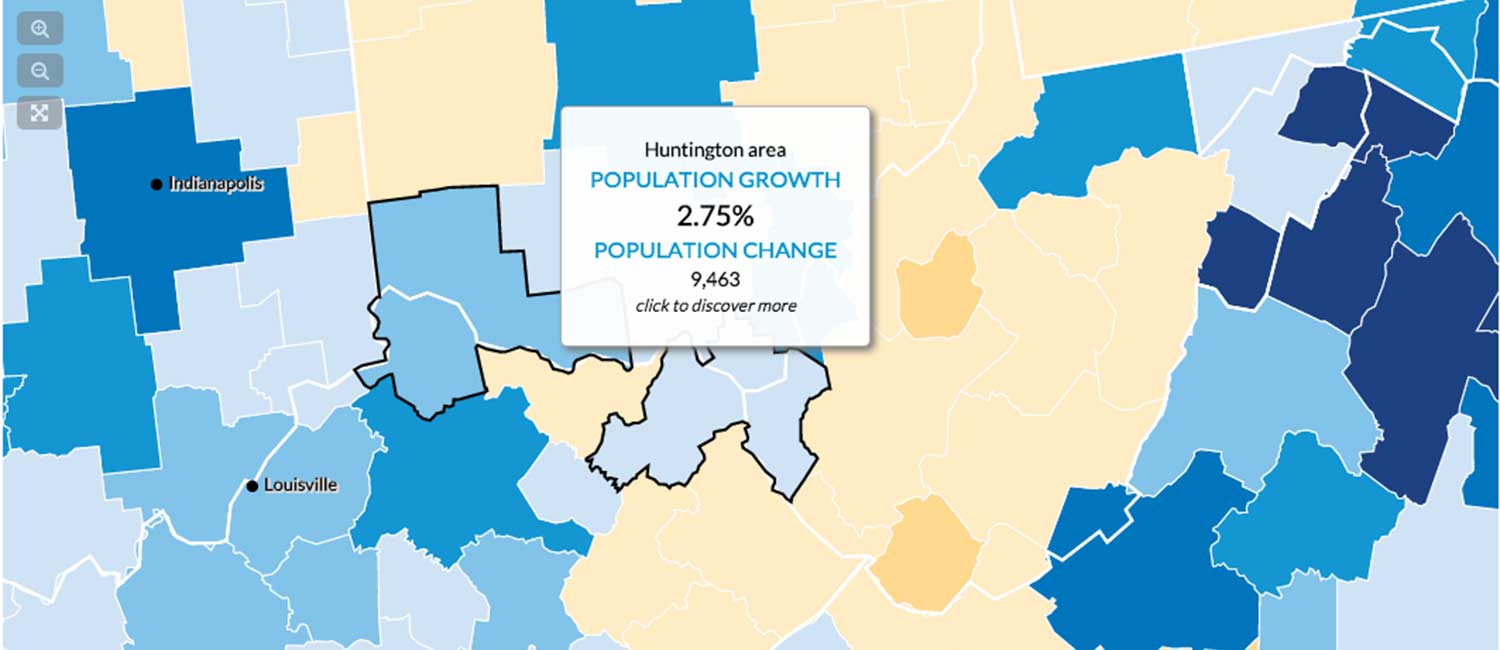
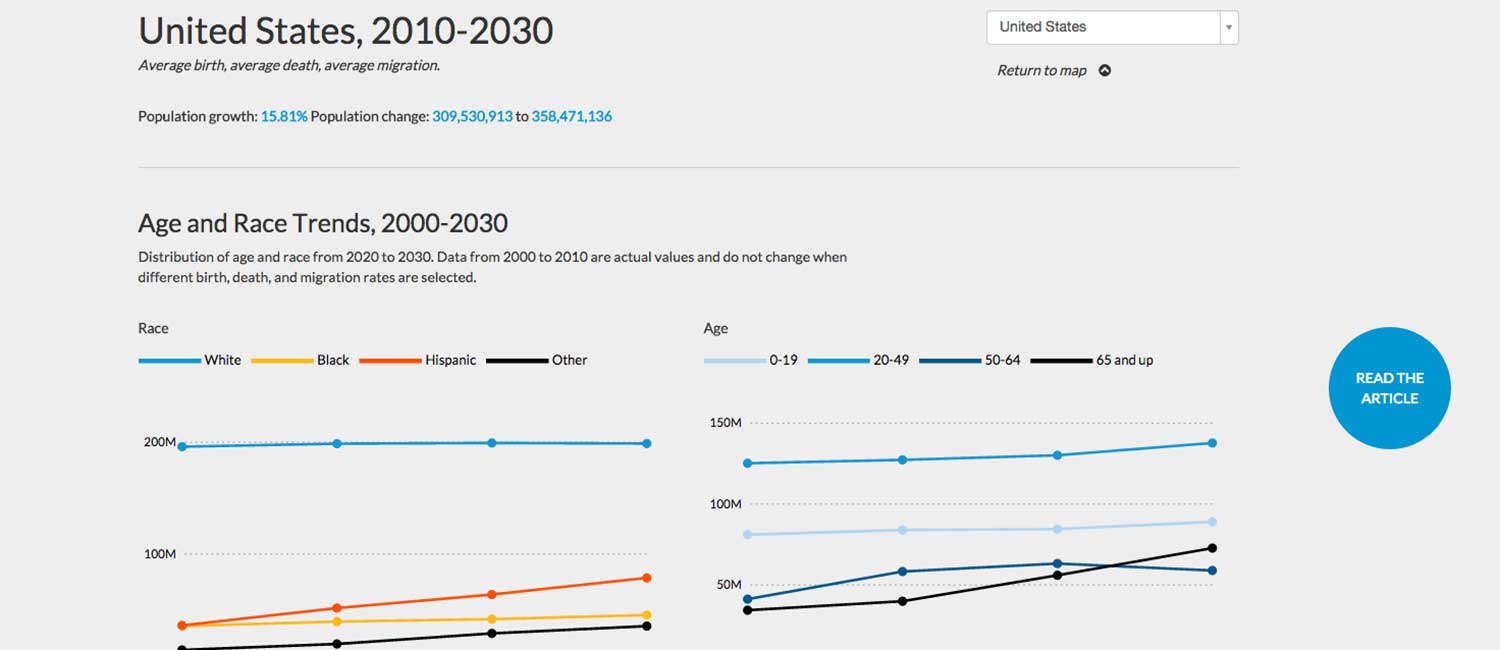
As a user clicked through the map, he/she was presented with a detailed view of the areas, showing breakdowns of age and race trends as well as population pyramids showing the distribution of ages within individual race groups.
I completed the intitial design portion of this project and led the team of developers and designers who continued the work for nearly a year. It has been an incredibly successful project for Urban, and, as researchers use the tool's methodology to do new analysis, the tool continues to evolve.